 |
||
| Strong evidence for a visible Huygens to
Cassini Correlation |
||
March 20, 2005
|
||
|
||
| For a comprehension
of the landscape details Cassini sees on Titan, it is extremly valuable
if an exact correlation with the detailed images of Titan´s
surface, obtained by Huygens, can be found. Here I argue that the
correlation I already supposed on the basis of the Huygens DISR images
and my Large Surface Coverage Mosaic ( "Where
did Huygens descend" ), can be
confirmed with help of higher resolved Cassini ISS images that have
been published recently. |
||
 |
||
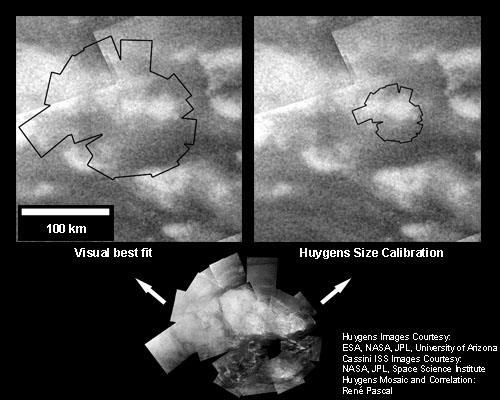
| Fig. 1) The image above shows two different attempts to find the correct correlation between the Huygens Mosaic (bottom) and the Cassini ISS images (top). The scaling of the mosaic in the upper right image bases on the calibration of the Huygens images, the correlation in the upper left is a visual best fit between both images, (Huygens mosaic and Cassini ISS images). At first glance, this visual best fit seems to be plausible, but it contains the problem that with the necessary image scaling the absolute size of the Huygens frames as well as the height above ground values are by a factor of roughly 2.5 different from what was originally published with the corresponding Huygens data. Nevertheless, this visual best fit still is my favorized Cassini to Huygens correlation, and in the following I will give a detailed analysis of the accordances I see. |
||
 |
||
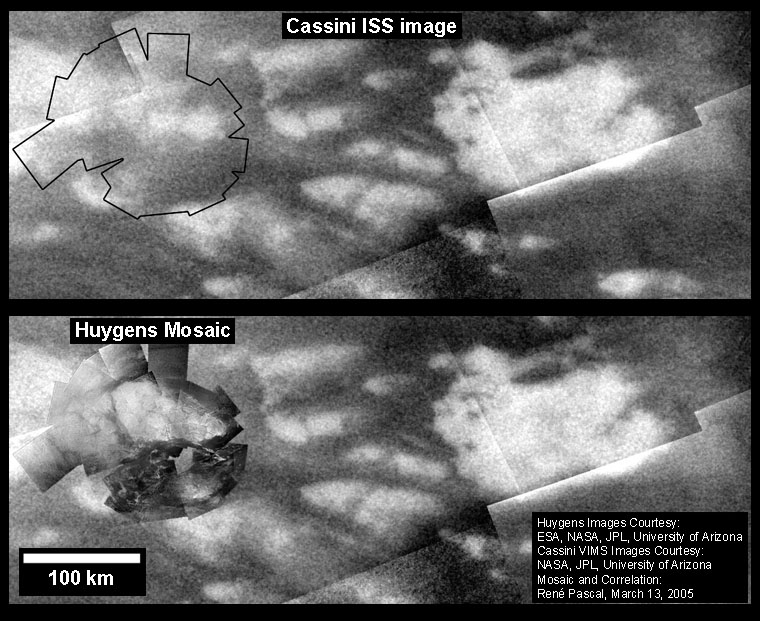
| Fig. 2 In Figure 2, Cassini´s Titan Mosaic, as published by the ISS Team at the Space Science Institute, is presented in a version with only the outline of the Large Surface Coverage Huygens Mosaic (top) as well as with the Mosaic as an inset (bottom) in the position and size I found to fit Cassini´s ISS Titan images best. This representation is useful for an attempt to correlate feeble details in the Cassini images with landscape features visible in the Huygens Mosaic. Following an interpretation of ESA scientists the bright surface structures may be outcrops of water-ice bedrocks, and the medium dark regions are dry or muddy, lower level areas, where dark hydrocarbon mixed soil has accumulated, I will refer to as "highlands" for the bright areas and "lowlands" for the dark ones. The coarse correspondence of the outline of the bright triangular shaped "highland" with this portion of Titans surface was already presented in the comparison with the Cassini VIMS data, and is also present in the ISS images. In the following I will concentrate on smaller details that become visible because of the higher resolution of the ISS images with respect to the VIMS data. |
||
 |
||
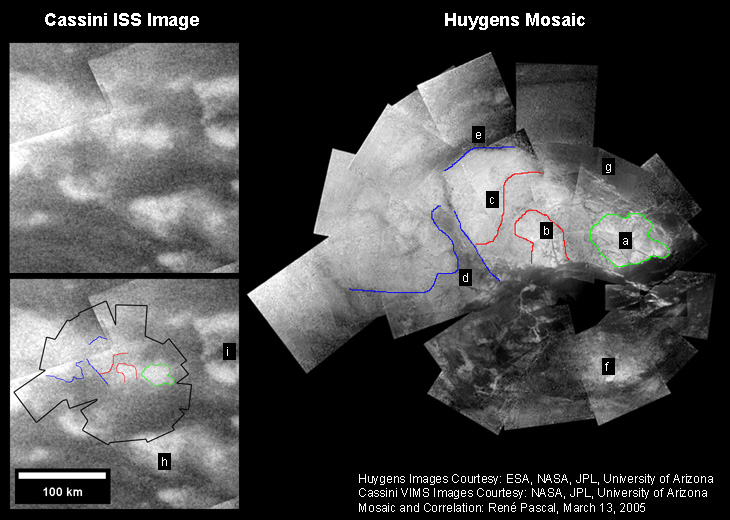
| Fig. 3 In the figure above, several areas in the Huygens Mosaic that exhibit a slightly different albedo than their neighboring regions are marked with lines. At a close inspection of the Cassini ISS images, corresponding regions can be identified. For all the following detailed inspections it should be taken into account, that a sometimes extensive, subjective photometric correction has been carried out on the individual Huygens frames, that is expected to be not perfect. The patches labeled a), b) and c) appear slightly brighter than the rest of this roughly triangular shaped "highland". Corresponding patches can be found in the Cassini ISS albedo map. Especially for a), even some details within this area seem to be visible in the Cassini images. The lower (southern) part of a) exhibits two patches that are surrounded by dark channels, at close inspection corresponding features can be seen in the Cassini maps (better seen in Figure 2 because of its higher resolution). The slightly darker area between a) and b) seems to be a little bit narrower in the Cassini images, this may be an effect of an imperfect photometric correction in my mosaic. I suppose the same for the area d), that should be darker when compared with the Cassini images. The large delta like structure north of d) finds its correspondence in the Casini images trouble-free. The northern boundary of the "highland" at e) is also represented in the ISS mosaic. The bright patch f) seems to be invisible in the Cassini images; I suppose my photometric correction of this area to overrepresent it with respect to the truth. The dark "lowland" that is present in g, as well as northwest, north, and east of g), is a strong argument that the upper right correlation in Figure 1) following the Huygens size calibration, is wrong. The shape boundary of the "highland" should be clearly different in this area when compared with the Huygens albedo maps. The fact that the area in g) is actually much darker than the highlands is confirmed when looking at the other panoramas (see "Panorama of the Shoreline " and "Huygens Distant View") as well as from close inspection of the corresponding raw images. South of f) a brighter patch of the surface is visible in the Cassini ISS image (h); this corresponds in shape and size to a large brighter area protruding a little from the south into the Huygens Mosaic. Huygens Distant View shows a little bit more of this patch (frames 424-464); a slightly darker, elongated spot may also be visible in the distant view (frames 525, 494, 473) as well as in the Cassini ISS images (above label h). Below i) the ISS albedo map shows another striking bright patch; looking at Huygens Distant View in the version that is not flatfield corrected, a similar bright patch can be spotted at the horizon (frames 605, 566, 509, 404, 436) that is in nice correspondence concerning shape, size and distance. With the Huygens size calibration (Figure 1 upper right) this patch should be clearly much farther apart, invisble behind the hazy horizon, and no other bright surface features of that size should be present in that area of the panorama. There are some more correspondencies of feeble details you may find in the Cassini images to structures visible in the Huygens mosaic. Many of them would be more or less close to the limit of speculation, so I will not mention them here. To sum up the results, this comparison of the Cassini ISS images with Huygens Large Surface Coverage Mosaic, shows a lot of accordances, but no strong discrepancy for the Mosaic positioning and scaling following my "visual best fit" (Figure 1 upper left). If the Huygens size calibration (Figure 1 upper right) is maintained, very little correspondence, but many discrepancies arise. Taking into account, that the Huygens altitude information above 40 km height based mainly on a timing sequence, not on an independent altimeter, an error as large as a factor of 2.5 may easily occur; unexpected upcurrents for instance may have delayed Huygens descend. If the correlation presented here can be definitely approved, an independent and reliable scalebar for Huygens images and a calibration for all other altitude dependent data is found. |
||
|
||
| |